อันนี้จะเป็นวง Monitor และ ว่าหลังจาก CI/CD จบแล้ว มา Monitor เพื่อให้ได้ Feedback กลับมา
Implement tools to track usage and flow

- Understand the inner loop
- inner loop - มองว่าเราแตก Branch มา Dev (Experiment) / Build + Test (Feedback) / Commit (Tax-เค้ามองว่ามันไม่ได้สร้าง Value หรือ บอก Feedback)
- Tangled loops - loop ใหญ่กว่า อันนี้มองว่าเป็นเอา Code จาก inner loop ส่ง Pull Request / Merge Request เข้าไป
- Loop optimization - ทำยังไงให้ Loop มันสั้นลง
- Refactor Code ให้มัน codebase เล็กลง ปรับเป็น Share Lib กับส่วนอื่นแทน
- หรือ จะเป็นการเพิ่ม Skill
- หรือ ลดเวลาให้ได้ Feedback ได้เร็ว เช่น Test ต่อ DB มา Mack TextFile เป็นต้น
- No silver bullet solution สำหรับรับ Feedback แต่เราต้องตามว่าเมื่อไหร่ที่มันช้า มีปัญหา และมาจัดการกับมัน
- Introduction to continuous monitoring - แนวคิดเดียวกับ CI/CD แหละ โดย Tool ที่ใช้ Azure Monitor โดยการทำ
- Enable monitoring for all your applications
- Enable monitoring for your entire infrastructure
- Combine resources in Azure Resource Groups
- Ensure quality through continuous deployment - จาก Azure Pipeline
- Create actionable alerts with actions
- Prepare dashboards and workbooks - เจ้า Azure Monitor จะเอาข้อมูล Metrics, Logs มาใช้สร้าง
- Continuously optimize จาก Application Insights track end-user behavior and engagement และ Impact Analysis

- Explore Azure Monitor and Log Analytics
- Microsoft Monitoring Agent service > ส่งข้อมูลมาที่ Log Analytic
- เราใช้ Kusto Query Language มา Query ข้อมูล
- หรือ จะสร้าง Dashboard
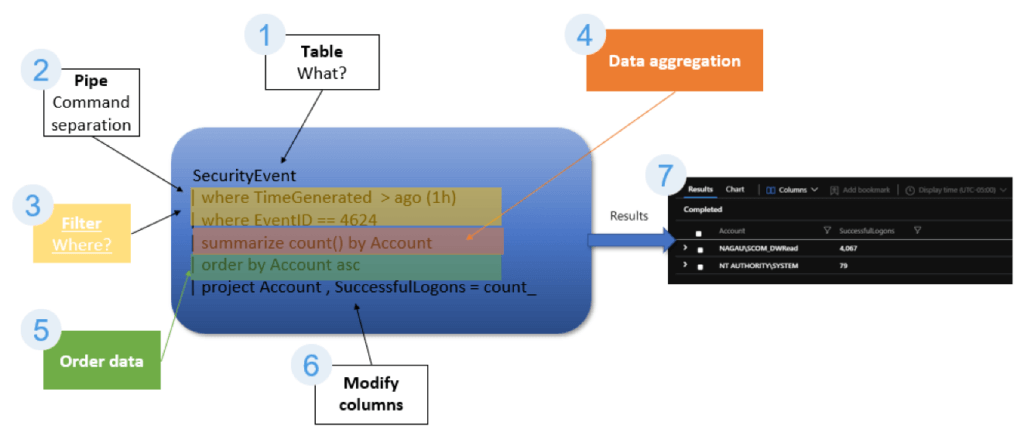
- KQL - Kusto Query Language - ภาษาคล้าย SQL + Powershell //มันชอบคั่นด้วย Pipe เพื่อดูข้อมูลที่สนใจ โครงสร้างของ Query ทั่วไป (Tabular expression) ตามรูปด้านบนเลย
- Tabular expression > Source | Operator1 | Operator2 | RenderInstruction
- let - set a variable เพื่อเอาทำ Function / View หรือเอามาทำ Logic จากข้อมูลที่ได้ Tabular expression
- set - control how a query executes and returns results หรือเอามาทำ Query Limit
//Tabular expression หรือกำหนด Take n ไว้ก็ตาม
//สุดท้ายมันจะกรองมาแสดงผลตาม truncationmaxsize and truncationmaxrecords
set truncationmaxsize=1048576;
set truncationmaxrecords=1105;
MyTable | where User=="UserId1"
---------------------------------
//ยึดตาม Take n
set notruncation;
MyTable | take 1000000
- KQL Filter จะใช้ Keyword Where + Summarize
- Explore Application Insights
- monitors app และส่ง telemetry data ทั้งใน+นอก Azure
- สำหรับการเชื่อม App เข้ามามี SDK ดูจาก key AppInsights Key.
- NOTE: สำหรับ Path Azure Monitor มันเหมือนลง Detail จาก [AZ-204] Instrument solutions to support monitoring and logging นะ
- Lab18: Monitor application performance with Application Insights
- Knowledge check: Implement tools to track usage and flow
Develop monitor and status dashboards
- สำหรับวิธีการทำ Dashboard มี Azure มี 5 แบบ
| Tools | จุดเด่น | จุดด้อย |
|---|---|---|
| Azure Dashboards | - Supports both metrics and logs. - Combine data from multiple sources - View with Azure RBAC - Automatic refresh | - Log charts are limited to the last 30 days - data series is limited to 10 - No interactivity with dashboard data |
| Azure Monitor-View Designer | - Rich visualizations for log data. - Interactive supports multi-level drill-in - Integrates into Log Analytic management model with workspaces and monitoring solutions. - create custom visualizations with log data. | - Supports logs but not metrics. - No personal views //เห็นเหมือนกันทุกคน - No automatic refresh. |
| Azure Monitor-Workbooks | - Supports both metrics and logs - parameters enabling interactive reports - Document-like flow | - No automatic refresh. - เหมือนกับการหา Insight มากกว่าดูภาพรวม Dashboard |
| Power BI | - Rich visualizations. - ง่ายกับการแชร์ - logs visualization in real-time. | - Supports logs but not metrics. - Realtime ไหม ขึ้นกับ License Power BI |
| Build your own custom application | ทำได้หมดตามที่ API เปิดให้ | ใช้ Effort มากเยอะ |
- Knowledge check: Develop monitor and status dashboards
Share knowledge within teams
- Share acquired knowledge within development teams
- เพราะไม่มีใครอยู่ตลอดไป //NO HERO
- Introduction to Azure DevOps project wikis
- รองรับ Mark Down และ GitHub Flavored Markdown (GFM) ถ้าเป็นพวก Diagram ใช้ตัว Mermaid
- สร้างเอง หรือ Publish Code as Wiki (ให้มันแปลง readme หรือ .md มาให้ แต่ต้องเป็น admin ของ repo)
- ส่วนถ้าอยากแก้ไข Wiki สิทธิ Contributor
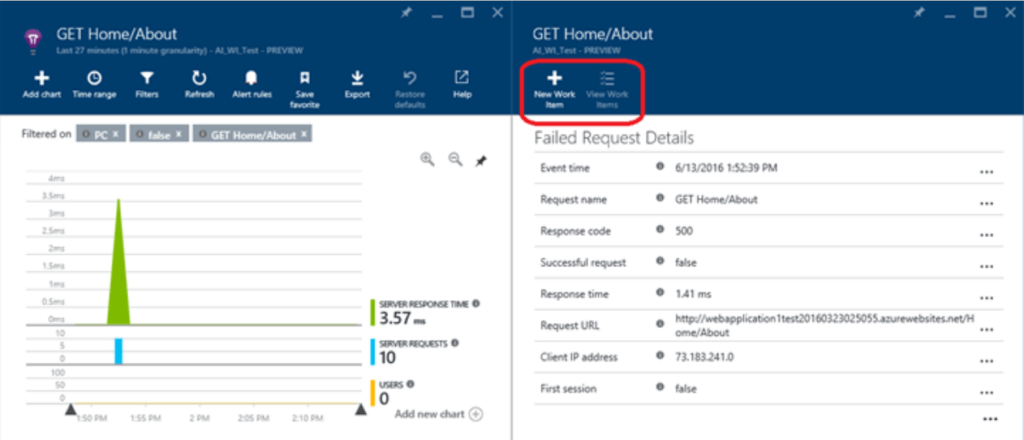
- Integrate with Azure Boards
- Work item สามารถถูกสร้างจาก Application Insights (Proactive detection / individual instances พวก exception, failures requests เป็นต้น)
- Advanced Configuration - out-of-the-box setting ที่ Azure DevOps ไม่มีโดยการ Config ผ่าน JSON-based
- Lab 19: Integration between Azure DevOps and Teams (MS Teams)
- @azure pipelines subscribe [pipeline url] command to subscribe to an Azure Pipeline. Create and Unlink only works with the Azure Boards integration
- Lab 20: Sharing Team Knowledge using Azure Project Wikis
- Knowledge check: Share knowledge within teams
Design processes to automate application analytics
- Assisting DevOps with augmented Search
- Augmented Search algorithm analysis: errors, risk factors, and problem indicators.
- Automatically identifies
- Integrate telemetry
- telemetry
- insights on which features end users use most, detect bugs and issues
- provide better visibility into the performance without asking for feedback directly from users
- telemetry data comes from application logs, infrastructure logs, metrics, and events.
- Telemetry enables you to answer questions such as:
- Are your customers using the features you expect? How are they engaging with your product?
- How frequently are users engaging with your app, and for what duration?
- What settings options do users select most? Do they prefer certain display types, input modalities, screen orientation, or other device configurations?
- What happens when crashes occur? Are crashes happening more frequently when certain features or functions are used? What is the context surrounding a crash?
- Challenges of telemetry - เก็บยังไงไม่ให้ user รู้สึกว่าติดตามข้อมูลส่วนบุคคล ถ้ามาไป user อาจจะปิดได้
- telemetry
- Examine monitoring tools and technologies
- Application Performance Management (APM) solutions
- that intelligently monitor, analyze, and manage cloud, on-premises, and hybrid applications and IT infrastructure.
- helps identify the root cause of issues
- advanced features
- Synthetic Monitoring - ensure tested and operate successfully from different points of presence เช่น Web / Mobile
- Alert Management - อันนี้นึกถึงภาพของ IRP ในมุม Security พอมี Case แล้ว Noti หรือ Assign คนได้
- Deployment Automation - avoid potential duplication and erroneous information
- Analytics
- Application Performance Management (APM) solutions
- Knowledge check: Design processes to automate application analytics
Manage alerts, blameless retrospectives and a just culture
- Examine when get a notification
- Application Insights automatically analyzes the performance ของ web application โดยได้ Smart Notification ในกรณี
- Response time degradation - Response Request ช้าลง
- Dependency duration degradation - API ที่เราไปเรียก ตอบสนองช้าลง
- Slow performance pattern
- smart detection notifications: default ส่งให้ owners/ contributors / reader's access ถ้าจะเอาออกก็มาแก้
- Application Insights automatically analyzes the performance ของ web application โดยได้ Smart Notification ในกรณี
- Explore how to fix it - จาก Notification มีการจัดการได้ ดังนี้
- Triage -ช่วยบอก user/service ที่กระทบ เอามาประเมิน Priority
- Scope - โดนทุก Zone หรือบางส่วน ?
- Diagnose - ตรวจสอบเพิ่มเติม จาก Profiler / snapshot debugger.
- Improve performance
- Triage - มันอาจจะแสดงสัญญาณบางอย่างจาก Graph และว่ามีปัญหา เช่น % traffic ลดลงไป จากเคสนี้ เราต้องไปดูว่าเกิดจากอะไร Network หรือป่าว ลองดูจาก availability tests หรือ Slow Page Load (อาจจะมี Error บางอย่าง)
- Diagnose slow page loads
- ใช้ performance metrics มาช่วยหาว่าทำไม Send Request Time สูง, server responds ช้า, request มีขนาดใหญ่
- Set up dependency tracking - บางทีตัวที่ช้า อาจจะ External Service
- หรือติดปัญหา Render แต่ละ Component ลองดู availability tests ในแต่ละ region การดึง JS / CSS / Image มีปัญหาอะไร Block ไหม
- High Client Processing time - ต้องลองดู Client Script(JS) มีอะไรที่ทำงานผิดปกติไหม
- Improve slow pages
- Slow loading (large files) - แก้ให้เป็น asynchronously / script bundling. Break the main page into widgets / ถ้า request ส่งด้วย json (มันมีใครส่งด้วยอย่างอื่นเหรอ ?) ตัว json มันบีบได้อีกนะ
- Slow server dependencies: เพิ่ม CDN หรือลองดูว่า External Service ที่ใช้อยู่ใน region เดียวกันไหม ?
- Capacity issues: - เพิ่ม Spec เอาตามข้อมูล metric นะ
- Note: script bundling ดูจากอันนี้ก็ดีนะ
- Understand server response time degradation //response time degradation (เหวี่ยง)
- สังเกตุได้อย่างไร อาจจะดู metric ที่ได้เทียบกับค่าย้อนหลัง 7 วันก่อน
- 90th percentile response time (เอา 90% ส่วนใหญ่ที่ได้) ปล. 90th percentile เหมือนเลขที่อยากได้ บางตำราบอกเอาที่ 95th หรือ 80th
ดูอันนี้เพิ่ม Metric ที่สําคัญของ Load Testing? | HowToAutomate.in.th - Count of this operation requests
- 90th percentile response time (เอา 90% ส่วนใหญ่ที่ได้) ปล. 90th percentile เหมือนเลขที่อยากได้ บางตำราบอกเอาที่ 95th หรือ 80th
- Correlation between degradation กับ related dependencies ดูใน Application Insight ดังนี้
- Profiler traces
- Performance reports in Metric Explorer
- Search for this call to view specific call properties.
- Failure reports - If count > 1 it means that there were failures in this operation
- สังเกตุได้อย่างไร อาจจะดู metric ที่ได้เทียบกับค่าย้อนหลัง 7 วันก่อน
- Reduce meaningless and non-actionable alerts - หลังจากใช้กันมานาน เราต้องมาปรับ Alert ให้เหมาะสม
- สุดท้าย ฺBlameless retrospective + ทำให้ DevOps เป็น Culture มี PDCA ที่ดี
- Knowledge check: Manage alerts, blameless retrospectives and a just culture
Reference
- AZ-400: Implement continuous feedback - Training | Microsoft Learn
- rod-trent/MustLearnKQL: Code included as part of the MustLearnKQL blog series (github.com)
Discover more from naiwaen@DebuggingSoft
Subscribe to get the latest posts sent to your email.


