สำหรับ Tool ที่มี
Azure Monitor
- What data does Azure Monitor collect?
- Application monitoring data
- Guest OS monitoring data
- Azure resource monitoring data
- Azure subscription monitoring data
- Azure tenant monitoring data
- Monitoring data platform
- Metric
- Log
- Insights and curated visualizations
- Application Insights (App Service)
- Container Insights
- VM Insights
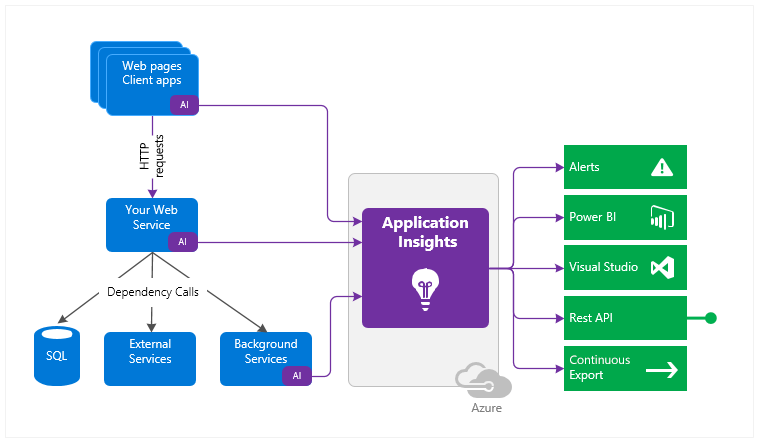
Application Insights

- Application Insights monitors
- Request rates, response times, and failure rates
- Dependency rates, response times, and failure rates
- Exceptions
- Page views and load performance
- AJAX calls from web pages - rates, response times, and failure rates.
- User and session counts.
- Performance counters from your Windows or Linux server machines, such as CPU, memory, and network usage.
- Host diagnostics from Docker or Azure.
- Diagnostic trace logs from your app
- Custom events and metrics
Discover log-based metrics
- Log-based metrics behind the scene are translated into Kusto queries from stored events.
- Standard metrics are stored as pre-aggregated time series. เหมือนเอา Log มารวม และดูจาก Key ตัวเดียว
Instrument an app for monitoring
- Auto-instrumentation - บาง Service ของ Azure รองรับอยู่แล้ว
- Instrumenting for distributed tracing
- Enabling via Application Insights SDKs
- Enable via OpenCensus ตัว OpenCensus เป็น Open-Source
Select an availability test
- URL ping test (classic) - ตรวจสอบ Resource ใน Azure
- Standard test (Preview) -
- Custom TrackAvailability test - create a custom application to run availability tests
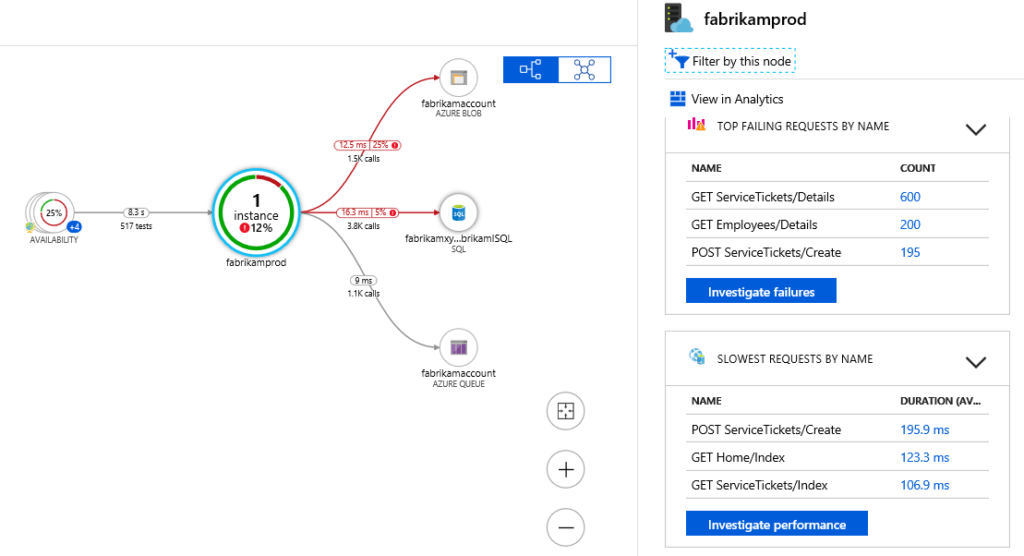
Troubleshoot app performance by using Application Map

- อันนี้เจ๋ง เอาปัญหาวาดเป็นกราฟ
Knowledge check - Instrument solutions to support monitoring and logging (Knowledge check)
Reference
Discover more from naiwaen@DebuggingSoft
Subscribe to get the latest posts sent to your email.


