สำหรับ Pandas ผมชอบเรียก panda เป็น library ที่ช่วยให้หมุน Data ออกมา สำหรับหา insight หรือ จะเอาไปแสดงผลก็ได้นะ โดย Pandas เป็นอีก Library ที่ต่อยอดจาก NumPy ที่ผมเขียนไว้ใน Blog ตอนก่อนครับ
มุมมองข้อมูลใน Pandas
- Series - Columns ข้อมูล ถ้าเทียบ Data Stucture จะเป็น List of Primitive Data Type ในภาพข้างต้นจะเป็น Int
- DataFrame ตารางข้อมูล หรือ เป็น List Of Object (Structure)
Get Pandas
*️⃣ Install
pip install pandas
*️⃣ Using
import pandas as pd
Mount Google Drive เข้ากับ Google Colab
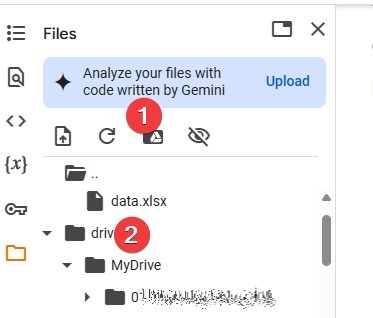
💡 สำหรับเคสนี้ ถ้าต้องการ Data จากข้างนอก Google Colab มีช่องทางให้ โดย Mount Google Drive ซึ่งมีขั้นตอน ดังนี้
- กดปุ่ม Mount Google Drive จากนั้นมีหน้าจอถามเลือก Email และกด Login ให้สิทธิให้เรียบร้อย
- หลังจาก Mount เสร็จ ตัว Google Drive ของเราโผล่ใน Folder ชื่อ drive
🅰️ เวลาใช้งาน ให้เลือกไปยังไฟล์ หรือ Folder ที่ต้องการแล้วคลิกขวา Copy Path ครับ
⚠️ ถ้าเอาไฟล์ไปไว้ใน VM Colab สร้างขึ้น ถ้าหมด Session ข้อมูลหายครับ
Sample Usecase
- Create DataFrame from a dictionary
data = {
    'Name': ['Ping', 'Kook', 'Bank', 'MT', 'Jenkins'],
    'Age': [34, 38, 33, 22, 43],
    'Occupation': ['Programer', 'Data Scientist', 'Doctor', 'SQL Admin', 'IT Support']
}
df = pd.DataFrame(data)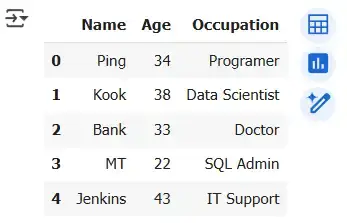
- Explore the DataFrame
📌 Display the x Rows
print(df.head())
print(df.head(3)) # Get First 3 Rows

print(df.tail())
print(df.tail(3)) # Get last 3 Rows
📌 summary statistics
print(df.describe())
          Age
count   5.000000
mean   34.000000
std     7.778175
min    22.000000
25%    33.000000
50%    34.000000
75%    38.000000
max    43.000000
# รวม Column ที่ไม่ใช่ตัวเลขด้วย
print(df.describe(include = 'all'))
        Name        Age Occupation
count      5   5.000000          5
unique     5        NaN          5
top     Ping        NaN  Programer
freq       1        NaN          1
mean     NaN  34.000000        NaN
std      NaN   7.778175        NaN
min      NaN  22.000000        NaN
25%      NaN  33.000000        NaN
50%      NaN  34.000000        NaN
75%      NaN  38.000000        NaN
max      NaN  43.000000        NaN
📌 get data frame information
print(df.info())
<class 'pandas.core.frame.DataFrame'>
RangeIndex: 5 entries, 0 to 4
Data columns (total 3 columns):
 #   Column      Non-Null Count  Dtype
---  ------      --------------  -----
 0   Name        5 non-null      object
 1   Age         5 non-null      int64
 2   Occupation  5 non-null      object
dtypes: int64(1), object(2)
memory usage: 252.0+ bytes
None
📌 shape บอกจำนวน Rows / Columns
print(df.shape)

# ผลลัพธ์
# (5, 3)
# 5 Rows
# 3 Columns
- Data Manipulation (Basic)
📌 Select By Column Name
# Select a single column
print(df['Name'])

# Select multiple columns
print(df[['Name', 'Occupation']])
📌 Select By Index ( .iloc[])
df.iloc[0]             # เอา Row แรก (Index 0)

df.iloc[[0,3]]         # เอา Row ที่ 0 และ 3

# กรณีที่ต้องการระบุ Column
df.iloc[[0,3], [0,1]]  # เอา Row ที่ 0 และ 3 // Column ที่ 0 (Name) และ 1 (Age)
📌 df[condition] เพื่อกรองข้อมูล ตาม Column
# Filter rows based on a condition
print(df[df['Age'] > 25])

print[(df['Age'] > 25 ) & (df['Occupation'] == 'Programer')]
📌 query - กรองแบบ SQL ถ้าเทียบ Syntax จะดูง่ายกว่า df[condition
# Querying the DataFrame
print(df.query('Age > 30'))

print(df.query('Occupation == "Doctor"'))
print(df.query('Age > 25 and Occupation == "Programer"'))

print(df.query('Name in ["Ping", "MT"]'))  # หาตาม Value
📌 .Filter() กรองข้อมูลตามเงื่อนไข มันจะไปหาจาก Index Label ปกติจะเป็นตัวเลข แต่แก้ตัวหนังสือได้ มีจุดเด่นที่เหนื่อกว่าแบบ df[condition] มันเลือกตามแกนได้ด้วย
- items ระบุชื่อให้มันไปหาตรงๆ เช่น "SQL Admin"
- like บอกบางส่วน เช่น "SQL"
- regex ใช้ Regular Expression
ตัว items / like /regex ทำเป็น List เข้าไปได้
และกำหนด Scope axis ได้ว่าหาตาม Row (0) หรือ Column (1) ถ้าไม่กำหนดจะหาทั้งหมด
Ref: https://pandas.pydata.org/docs/reference/api/pandas.DataFrame.filter.html
df.filter(items=None, like=None, regex=None, axis=None)

df.filter(like = '1', axis=0)
# ลองกำหนด Ladel เป็นตัวหนังสือ index
import numpy as np
df = pd.DataFrame(np.array(([1, 2, 3], [4, 5, 6])),
                  index=['mouse', 'rabbit'],
                  columns=['one', 'two', 'three'])
# ==Items ================================
df.filter(items=['one', 'three'])
# result
#          one  three
# mouse     1      3
# rabbit    4      6

# ==Regex================================
df.filter(regex='e$', axis=1)
#          one  three
# mouse     1      3
# rabbit    4      6
📌 Adding new columns
# Add a new column
df['Salary'] = [70000, 60000, 80000, 75000, 81234]
print(df)
📌 Remove Column
# df.drop('column name', axis = 1)  1 = column / 0 =row
df= df.drop('Salary', axis = 1)
📌 Remove Row
# remove index 2 = bank
df= df.drop(1, axis = 0)
📌 Sort Value เรียงข้อมูล
df.sort_values(by='Age', ascending=True)  # Sort ตาม Column Age เรียงจากน้อยไปมาก

df.sort_values(by='Age', ascending=False)  # Sort ตาม Column Age เรียงจากมากไปน้อย

# ==================================================
# Sort Multiple Column  By List of Column
# - dropna() เดี๋ยวอธิบายต่อไป
df.dropna().sort_values(by=['Age', 'Name '], ascending=False)
- Data Manipulation (Grouping & Aggregation)
📌 Grouping data ช่วยให้ง่ายขึ้นแบบ SQL Group By
# Group by a column and calculate mean
grouped_df = df.groupby('Occupation')['Age'].mean()
print(grouped_df)

# ถ้าไม่ทำจะเป็นท่ายาก
# df[df['Occupation'] == 'Data Scientist']['Age'].mean()
# df[df['Occupation'] == 'Programmer']['Age'].mean()
# ...
📌 Aggregation คำนวณ Basic Stat ได้หลายตัวพร้อมกัน
df.groupby('Occupation')['Age'].agg(['min','max', 'median', 'mean', 'std'])📌 Aggregation อันแรกข้อมูลมันน้อย ผมว่า Penguin DataSet ดีกว่า โดยเจ้าตัว agg ใช้ได้หลาย Function ตามที่ numpy ทำได้
- sum() - หาผลรวม ของ Column / Series
- min()
- max()
- mean() - หา Average ของ Column / Series
- size()
- describe() - Generates descriptive statistics
- first() - Compute the first of group values
- last() - Compute the last of group values
- count() - Compute count of column values
- std() - Standard deviation of column
- var() - Compute the variance of column
- sem() - Standard error of the mean of column
penguins.groupby('species')['bill_length_mm'].agg(['min','max', 'median', 'mean', 'std'])# - กรณีใช้ Group By หลาย Column result_groupby = penguins.groupby(['island','species'])['bill_length_mm'].agg(['min','max', 'median', 'mean', 'std', 'var', 'count', 'sem', 'unique']).reset_index()

นอกจากนี้ตัว Aggregation (.agg) เรายังสามารถเขียน Custom Function ได้ด้วย อาทิ เช่น Unique Count
# Define a function to apply value_counts and return as a DataFrame
def value_counts_df(series):
    return list(series.value_counts().items())

# ใช้ตัว value_counts_df ที่เรา Custom
result_groupby = penguins.groupby(['island','species'])['bill_length_mm'].agg(['min','max', 'median', 'mean', 'count', value_counts_df]).reset_index()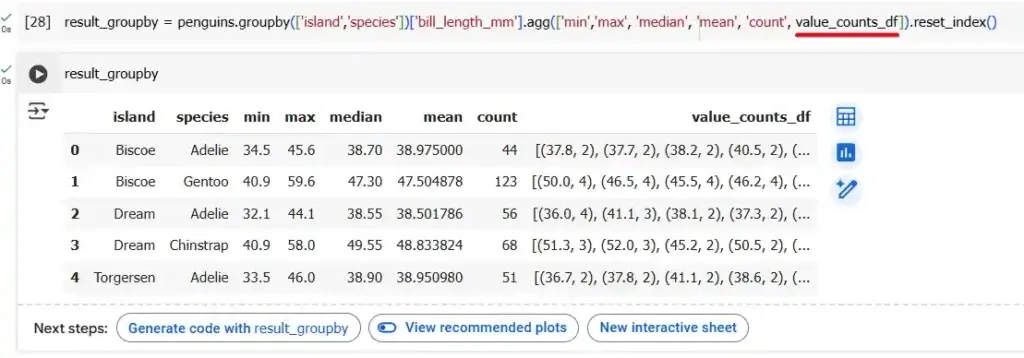
- Data Manipulation (Handle NaN Value)
📌 ดึงข้อมูล เอาจาก Penguin DataSet
penguins = pd.read_csv('/PathToYourData/penguins.csv')ในกรณีที่ Data เป็น Null หรือ NaN ต้อง มาจัดการ โดยใน Pandas มีเครื่องมือช่วยตามนี้
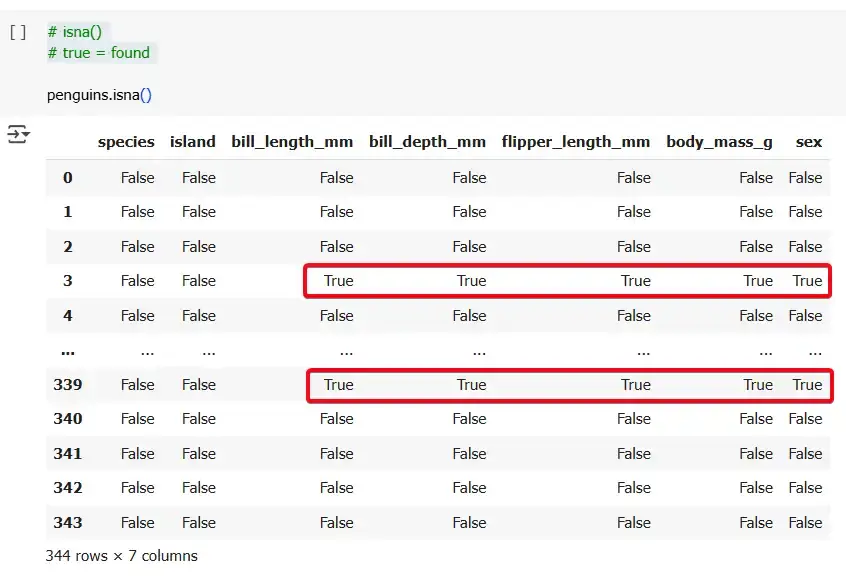
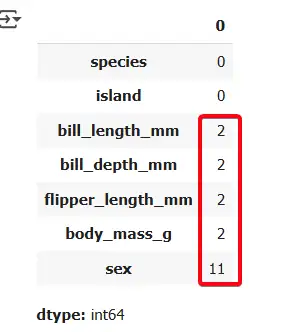
📌 isna() - ตรวจว่าค่าไหนเป็น NaN
# isna()
# true = found
penguins.isna()
# summary per column
penguins.isna().sum()
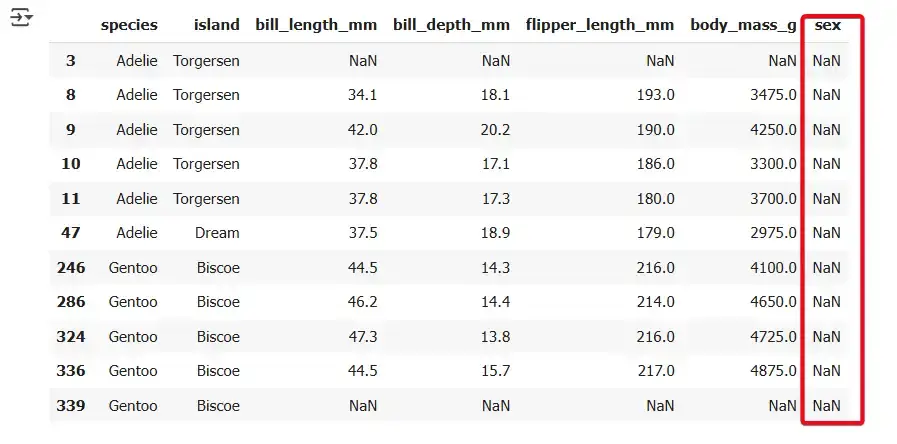
# filter missing value in sex column
penguins[penguins['sex'].isna()]
📌 ถ้ามีข้อมูลมากพอ เราสามารถตัด NA / NaN ออกได้ โดยการเรียกใช้ dropna()
# Check NA Column
penguins[penguins['bill_length_mm'].isna()]

# Drop Remove NA
clean_penguins = penguins.dropna()
clean_penguins.head(15)
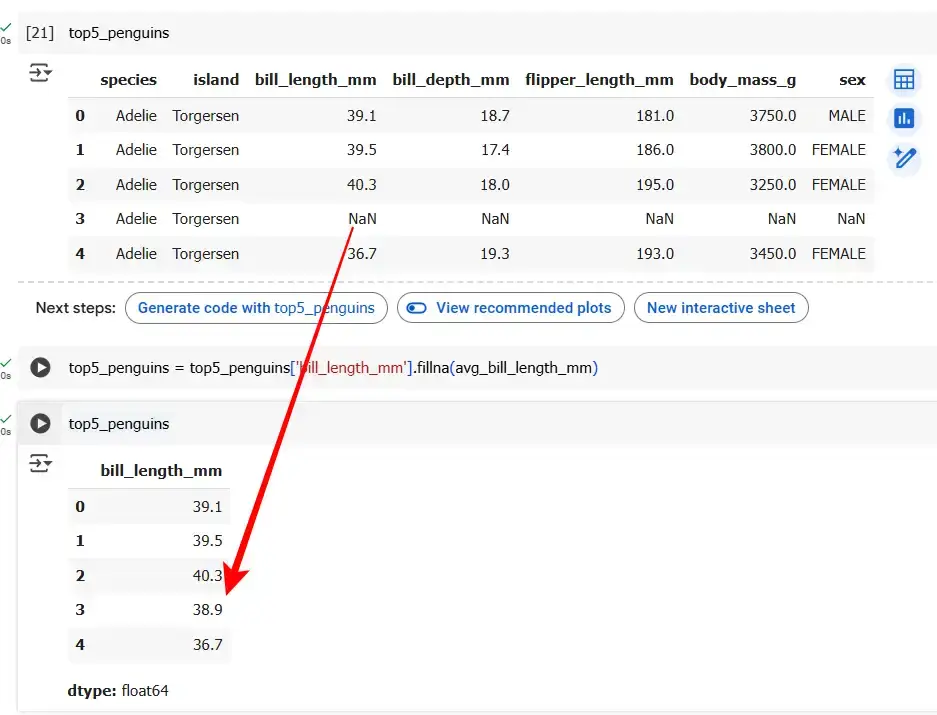
📌 เติมค่า NA มีหลายวิธีใน แต่ในนี้ของใช้ค่า mean (Mean Imputation) และเรียกใช้ fillna()
top5_penguins = penguins.head(5)
# ==================================
# Cal Average Mean
avg_bill_length_mm = top5_penguins['bill_length_mm'].mean()
print(avg_bill_length_mm)    # 38.9

# ==================================
# Fill NA
top5_penguins = top5_penguins['bill_length_mm'].fillna(avg_bill_length_mm)
- Data Manipulation (Merge หรือ Join Data Frame)
จริงๆแล้วใน Pandas มีทั้ง merge และ join เลย โดย key ที่สำคัญ
- merge - combine DataFrames based on the values ของ Column / Rows
- join - combine DataFrames based on their indexes
⛙ merge example
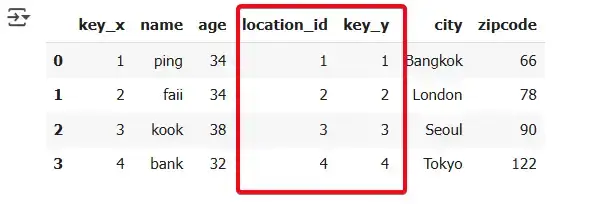
คล้ายกับ SQL Join โดยการเตรียมข้อมูล
left = {
    'key' : [1,2,3,4],
    'name' : ['ping', 'faii', 'kook', 'bank'],
    'age' : [34,34,38,32],
    'location_id': [1,2,3,4]
}

right = {
    'key' : [1,2,3,4],
    'city' : ['Bangkok', 'London', 'Seoul', 'Tokyo'],
    'zipcode' : [66, 78, 90, 122]
}

df_left = pd.DataFrame(left)
df_right = pd.DataFrame(right)
pd.merge(df_left, df_right, left_on='location_id', right_on='key', how='left') # ถ้า Column เหมือนกันใช้ on='ชื่อkey'
⛙ join example
จาก merge แล้วมาดู Join บ้าง
import pandas as pd

df1 = pd.DataFrame({'value1': [1, 2, 3]}, index=['A', 'B', 'C'])
df2 = pd.DataFrame({'value2': [4, 5, 6]}, index=['A', 'B', 'D'])

# inner join
result = df1.join(df2, how='inner')

print(result)

# result
#    value1  value2
# A       1       4
# B       2       5
Merge ดูยืดหยุ่นกว่า Join และใกล้เคียงกับ SQL ด้วย
- Save the DataFrame (For Share / Collaboration)
📌 Save
# Save the DataFrame to a CSV file
df.to_csv('modified_sample_data.csv', index=False)
📌 Load
# Read the CSV file into a DataFrame
df = pd.read_csv('modified_sample_data.csv')
- Basic Plot in Pandas (COVID-19 Data)
ตัว Pandas ใช้ plot ได้นะแต่จริงๆ ระหว่างเขียนอยากได้ข้อมูลเยอะขึ้น เลยลองเอา Covid Data
import pandas as pd

url = 'https://covid.ourworldindata.org/data/owid-covid-data.csv'
covid_data = pd.read_csv(url)
อันนี้ลืมเขียน มา Recap เรื่อง Unique / Value Count
🔬 Unique - ดูว่ามันข้อมูลเท่าไหร่
covid_data['location'].unique()
🔬 value_counts - นับจำนวนข้อมูลตามกลุ่ม
covid_data['location'].value_counts()
ถ้าเราดูใน Google Colab มันมีแนะนำ Plot อยู่นะ
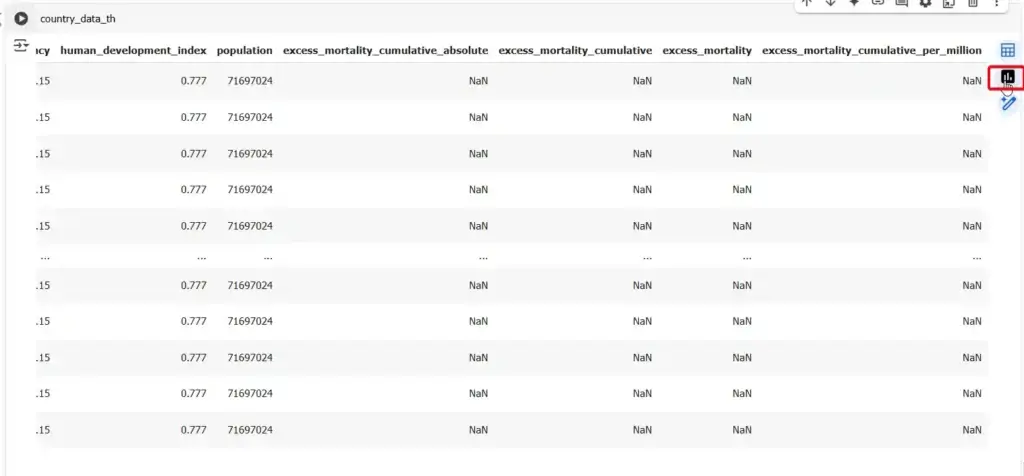
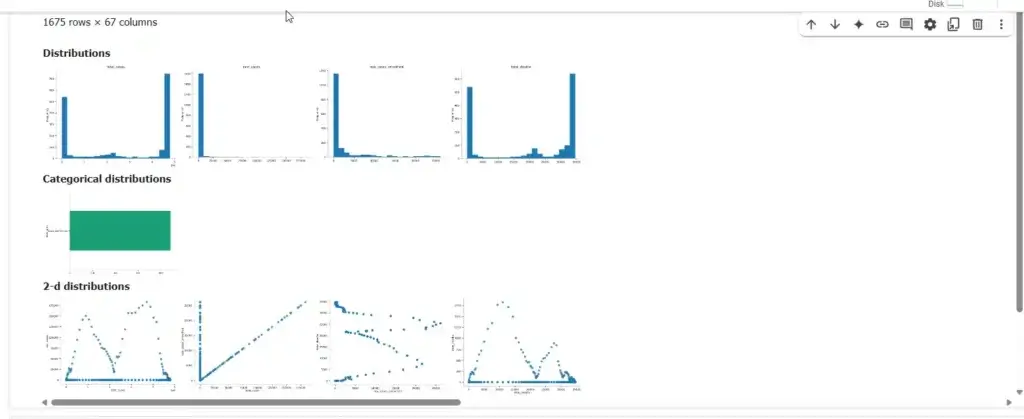
ลองดูใน Basic Plot ใน Pandas บ้าง
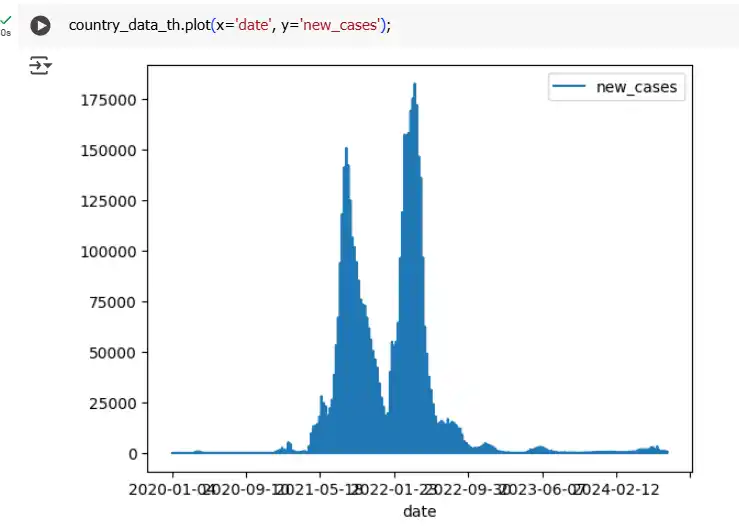
📊 simple barplot
# กรองข้อมูลเฉพาะของไทย
country_data_th = covid_data[covid_data['location'] == 'Thailand']

country_data_th.plot(x='date', y='new_cases');
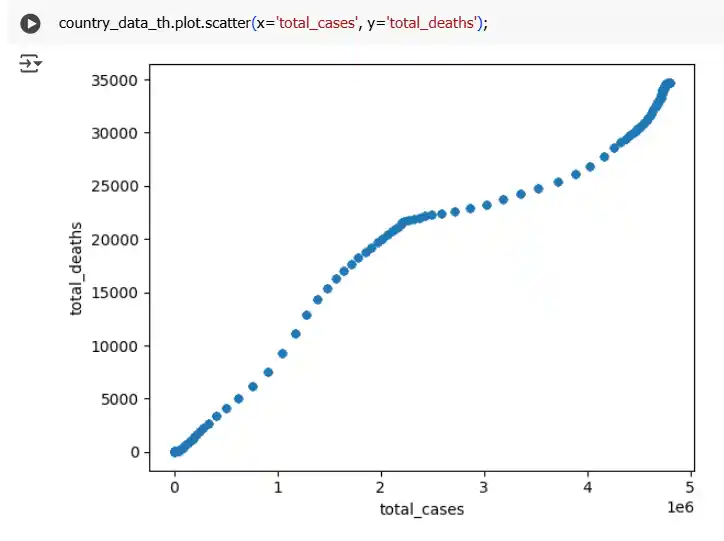
📊 scatter plot
country_data_th.plot.scatter(x='total_cases', y='total_deaths');
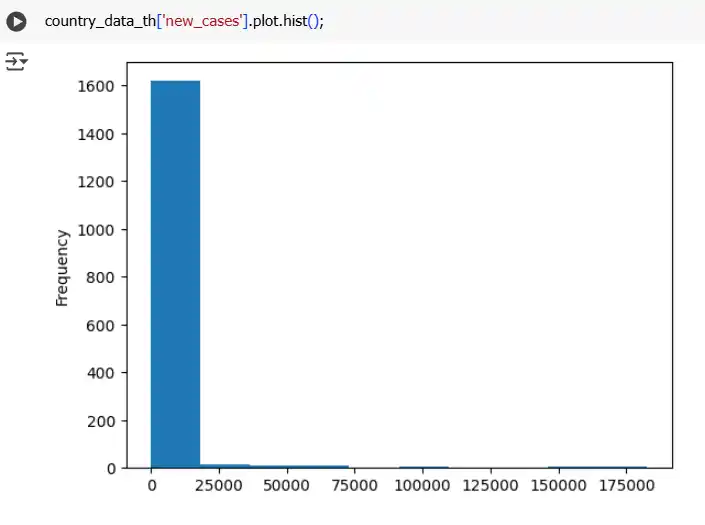
📊 histrogram
country_data_th['new_cases'].plot.hist();
# Convert date column to datetime objects
country_data_th['date'] = pd.to_datetime(country_data_th['date'])
# Get Year
country_data_th['year'] = covid_data['date'].dt.year

# Group by year and sum total deaths
yearly_deaths_th = country_data_th.groupby('year')['total_deaths'].sum()

yearly_deaths_th

# plot
yearly_deaths_th.plot(x='year', y='total_deaths');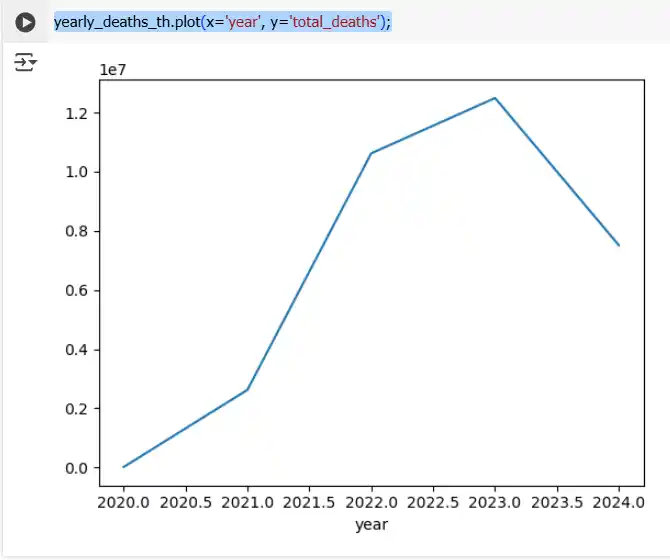
- Correlation
ตัว Pandas เองมีตัวช่วยหาความสัมพันธ์ (Correlation) ของข้อมูล มีรูปแบบตามนี้
DataFrame.corr(method='pearson', min_periods=1, numeric_only=False)
- method = ‘pearson’, ‘kendall’, ‘spearman’ หรือ Custom Logic
- min_periods = the number of observations required per pair of columns for a valid result.
- numeric_only = true (float, int, boolean) / false
ตัวอย่าง ดังนี้
# Default method='pearson'
country_data_th.corr(numeric_only = True)

country_data_th.corr(method='pearson', numeric_only = True)
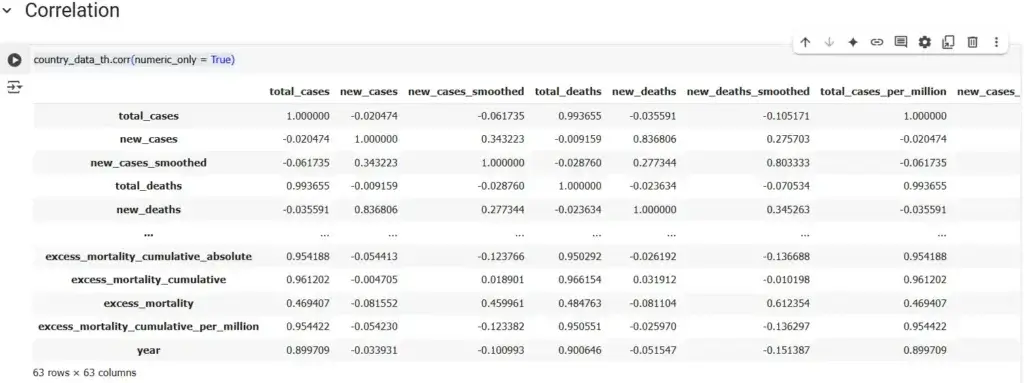
สำหรับผลลัพธ์มีค่าระหว่าง -1 ถึง 1 โดยตีความได้ ดังนี้
- +1 indicates a perfect positive linear relationship,
- -1 indicates a perfect negative linear relationship,
- 0 indicates no linear relationship.
Ref: https://pandas.pydata.org/docs/reference/api/pandas.DataFrame.corr.html
ปิดท้าย ถ้าใครอ่านอาจจะงง เพราะผมใช้ Data หลายตัวเลย จดเอง ยาวมาจนถึงใช้ Public Data Set
สำหรับตัวอย่างอื่นๆ ลองดูจาก Google colab อันนี้ และ อีกอันได้
Discover more from naiwaen@DebuggingSoft
Subscribe to get the latest posts sent to your email.


