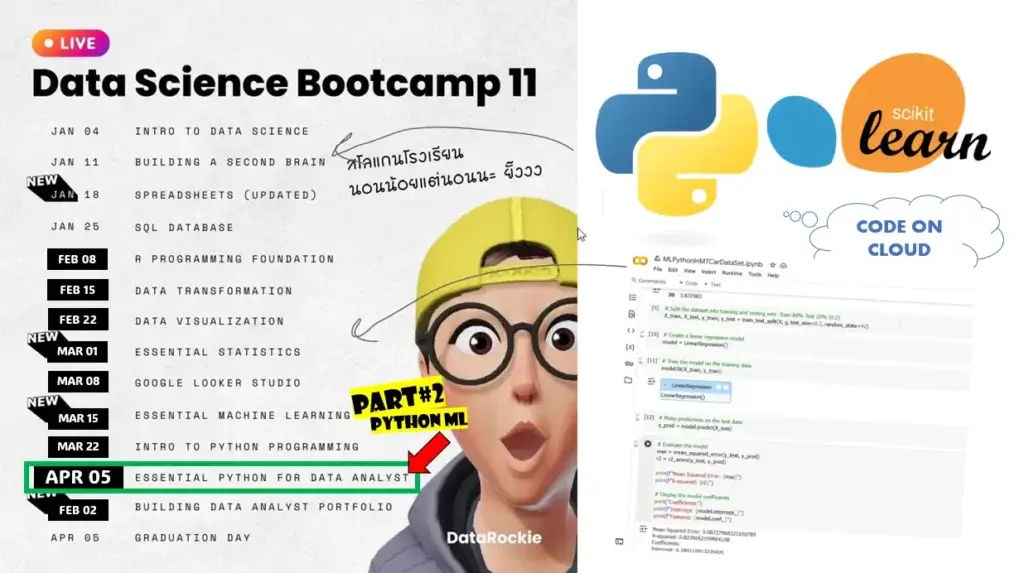
สำหรับใน Live นี้มา Recap Python for Data Analyst 2 และ Intro to Data Sci (ตอนอรกเขียนไว้ เดียวกลัวมันยาว แยกอีกอีนน่าจะดีกว่า
ส่วนแรก Python for Data Analyst
ส่วนนี้เรียกว่าเป็นการรวม Blog เหมือนเดิมครับ โดยมีส่วนที่แรก
และมีหัวข้อ Blog เก่าๆในส่วน Python
หัวข้อที่เกี่ยวข้อง
- [MITx: 6.00.1x] Week 1: Intro to Python Primitive Data Type / if-else / IO / Function
- [MITx: 6.00.1x] Week 2: Approximate Solutions & Bisection Search + Problem Solving
- [MITx: 6.00.1x] Week 3: Structure Type / Side Effect
- [MITx: 6.00.1x] Week 4: Testing & Debugging & Assertion
- [MITx: 6.00.1x] Week 5: Type Hint / Lambda / Object Oriented Programming
- [MITx: 6.00.1x] Week 6: Algorithm + Big O
- [MITx: 6.00.1x] Week 7: Simple Plot
- เสริมส่วน list comprehension
ปกติใน python เวลาจัดการข้อมูลใน List Code มันจะเว้นเว้อระดับนึง
squares = []
for x in range(10):
    squares.append(x**2)

print(squares)
พอเวลาผ่านไปตัว Python เองมีวิธีการย่อให้ Code มันสั้นกระชับลดรูป For จาก เดิม 3 บรรทัดเหลือบรรทัดเดียว
squares = [x**2 for x in range(10)]
ส่วนสุดท้ายแนะนำการทำ Machine Learning
แนะนำการทำ Machine Learning โดยใช้ sklearn ครับ เหมือนเคยจะมีแตะไว้นานแล้ว แต่ไม่ได้ Blog ไว้รอบนี้ได้มา Blog แล้ว โดยมี Recap กันก่อน
Simple ML Pipeline
Full Data --> TRAIN DATA 80% --> TRAIN MODEL --> SCORE MODEL --> EVALUATE MODEL
          |                                          ^
--> TEST DATA 20% ------------------------|- Full Data โดย
-Randoms Spiltมาทำ Train / Test Data แบ่ง 80 / 20 หรือ 70/30
- จากนั้น Prep Data Train ทำ Exploratory Data Analysis เข้าใจภาพรวมข้อมูล ทำ Normalize จาก Z Score และไปปรับทาง Test ต่อ - Train model - สร้าง Model
- Score model - เอา Model ไปลองทำนายจากข้อมูล Test โดยจะได้ root mean square / precision recall /accuracy
ถ้า Accuracy ตอน TRAIN > SCORING ไม่ดี มัน overfit ไป
- Evaluate model - สรุปผลว่า Model มันผ่านเกณฑ์ หรือยัง ทั้งในมุม Technical + Business นะ เอาง่ายๆ ลงทุนแล้วได้กำไรเท่าไหร่ คนที่ตัดสิน CEO CFO MKT คนให้ Requirement แล้วมาตรงลงกัน เช่น ไปหา Accuracy เพิ่มขึ้นจะได้คุ้มทุน
- OUTPUT > Model บอก อะไร
- OUTCOME > ผลกับ Business
Process ไม่ได้ทำแล้วจบไปนะ มันจะเป็น Iterative Process เอาข้อมูลเข้าไป Retain เรื่อยๆ จนกว่า Evaluate พร้อมใช้งานจริง ใช้เวลา + ข้อมูลพอสมควรเลย
Key generalize new / unseen data ได้ ไม่ใช่ทำนายถูกแค่ training
โดยจากที่เรียนใน R ตัว Python ทำได้ โดยใช้ Workflow เดียวกัน ตาม Code ตรงนี้ สามารถไล้ตาม Comment ได้นะ คิดว่าคล้ายกับใน live อยู่ เพราะใช้ DataSet เดียวกัน
import pandas as pd
from sklearn.model_selection import train_test_split
from sklearn.linear_model import LinearRegression  # ถ้าใช้ Algorithm อื่นปรับตรงนี้
from sklearn.metrics import mean_squared_error, r2_score

# 1 Prepare Data
# Load the mtcars dataset
url = "https://raw.githubusercontent.com/selva86/datasets/master/mtcars.csv"
df = pd.read_csv(url)

# Check Data
print(df.head())

# Define the independent variables (features) and the dependent variable (target)
X = df[['hp', 'wt']]  # Features: Horsepower and Weight
y = df['mpg']  # Target: Miles per gallon

# 2 Split Data For Train & Test
X_train, X_test, y_train, y_test = train_test_split(X, y, test_size=0.2, random_state=42)

# 3 Train Mode
model = LinearRegression()  # ถ้าใช้ Algorithm อื่นปรับตรงนี้
model.fit(X_train, y_train)

# 4. Score Make predictions on the test data
y_pred = model.predict(X_test)

# 5. Evaluate the model
mse = mean_squared_error(y_test, y_pred)
r2 = r2_score(y_test, y_pred)

print(f"Mean Squared Error: {mse}")
print(f"R-squared: {r2}")

# Display the model coefficients
print("Coefficients:")
print(f"Intercept: {model.intercept_}")
print(f"Features: {model.coef_}")
นอกจากนี้มีอัลกอริทึมอื่นๆ เช่น RandomForestRegressor / DecisionTreeRegressor ถ้าใน code ข้างต้นลองดูใน Comment ถ้าใช้ Algorithm อื่นปรับตรงนี้
หรือจะลอง Run ใน Google Colab ก็ได้
Discover more from naiwaen@DebuggingSoft
Subscribe to get the latest posts sent to your email.


