หัวข้อ
- Boost your technical skills with Microsoft Learn and GitHub Skills
- How CSA help shaping proper cloud services through CCSK and CCM
- Isolate Multiple Ingress Resources and Policies Using Ingress Class in Kubernetes
- What is the difference between penetration test and smart contract audit?
- Your Data-Driven Career Path: Turning data into information
- MySQL Performance Tuning
- “Log“ (2564 & PDPA preparation)
- Into the blue
- When you create the ClusterIP service in Kubernetes, what happens to the iptables rules?
- GitLab on Docker
- Zero Trust Security
- System Monitoring
“Log“ (2564 & PDPA preparation)
Speaker Jedsada Thongkanluang
ไม่เชี่ยวเรื่องนี้เลย อาจจะเขียนและงงๆไปครับ
- พรบ.คอม 2550
📚 เพิ่งรู้อุปกรณ์ที่เก็บ Log ต้องผ่านมาตรฐานด้วยนะ
- หน่วยงาน DTEC – สถาบันประเมินและรับรองเทคโนโลยีดิจิทัล (ปรด.) Digital Technology Evaluation and Certification Institute (DTEC) (nectec.or.th)
- เพื่อให้มีมาตรฐาน ความเชื่อถือ และนำไปให้ในทางกฏหมายได้
📚 Log คือ อะไร

📚 Log ประกอบด้วยอะไร

📚 Centralize Log Management
- Hardware
- Standard Log Format
- ตัว Log มีหลายแบบอีก Log ภายในองค์กร หรือ Log การให้บริการลูกค้า เช่น FTP / Email
📚 Inventory Asset ของอุปกรณ์ในองค์กร
📚 จัดกลุ่มว่าองค์กรเป็นกลุ่มไหน เช่น ผู้ให้บริการอินเทอร์เน็ต เป็นต้น
- PDPA มีอะไรเพิ่มเติมบ้าง
📚 PDPA มีการ Extend มาเสริมคำอธิบายในกฏหมายลูกของ PDPA (กฎหมายลูก พ.ร.บ.คุ้มครองข้อมูลส่วนบุคคล รวม 4 ฉบับ) ว่าต้องเก็บ
📚 Log ต้องมีความพิเศษขึ้นมา อย่าง Audit Log
📚 User Matrix / Permission
📚 Data Map / Data Flow ว่าข้อมูลไหลไปอย่างไร และมีข้อมูลส่วนไหนเป็น Personally identifiable information (PII)
📚 ถ้าทำตาม ISO 27001 12.4.1 / 12.4.2 / 12.4.3 จะ Compliance กับ PDPA ได้
Resource:
- เปรียบเทียบ พ.ร.บ.คอมฯ พ.ศ. ๒๕๕๐ และ พ.ร.บ.คอมฯ พ.ศ. ๒๕๕๐ ซึ่งแก้ไขเพิ่มเติมโดย พ.ร.บ.คอมฯ พ.ศ. ๒๕๖๐ - IT Chulalongkorn University
- รู้ลึก PDPA เอกสารแม่แบบสำหรับการดำเนินการของผู้ควบคุมข้อมูลส่วนบุคคลภาครัฐ (Version 2.0) - สำนักงานพัฒนารัฐบาลดิจิทัล (องค์การมหาชน) สพร. หรือ DGA
- Live
Into the blue
Speaker Chonlatit Rujiphut
- Blue Team Role
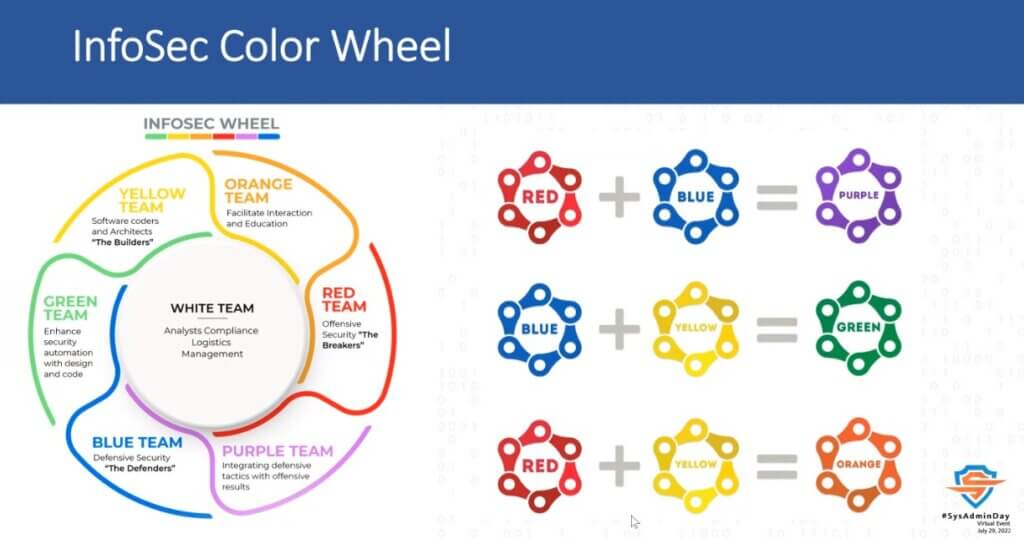
🛡️ InfoSec Color Team
- Red Team (Hacker / Penetration Tester)
- Blue Team (Defender) จากนั้นมีแบ่งสีย่อยๆ
- Yellow Team ที่เข้าใจ Architecture / Dev และแต่ละสีมาผสม Role กัน
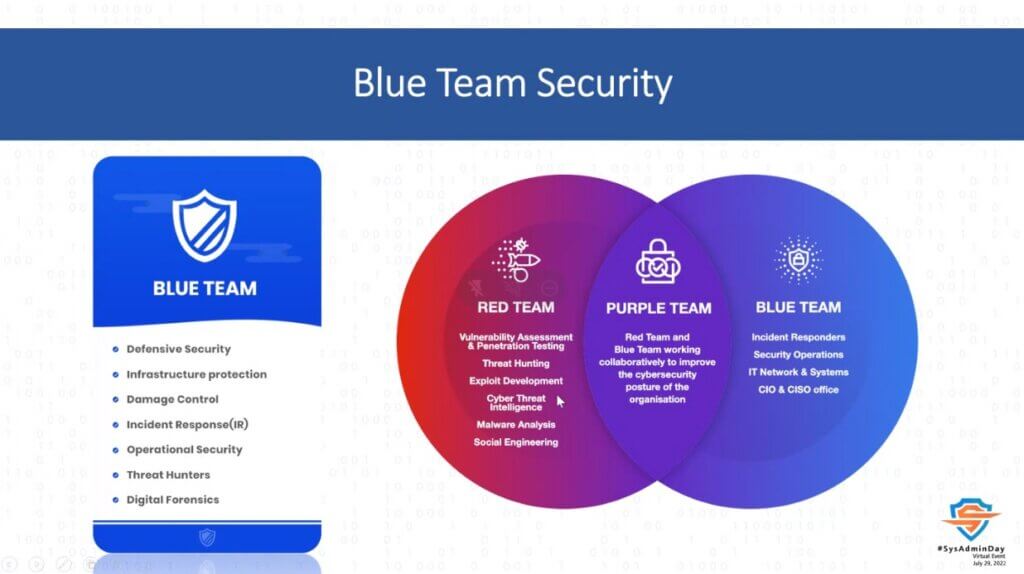
🛡️ Blue Team - จัดการ Incident and Response และมาปรับ System Infra ให้แข็งแกร่งขึ้น ส่วนตัวยังมองว่า System Admin + Security
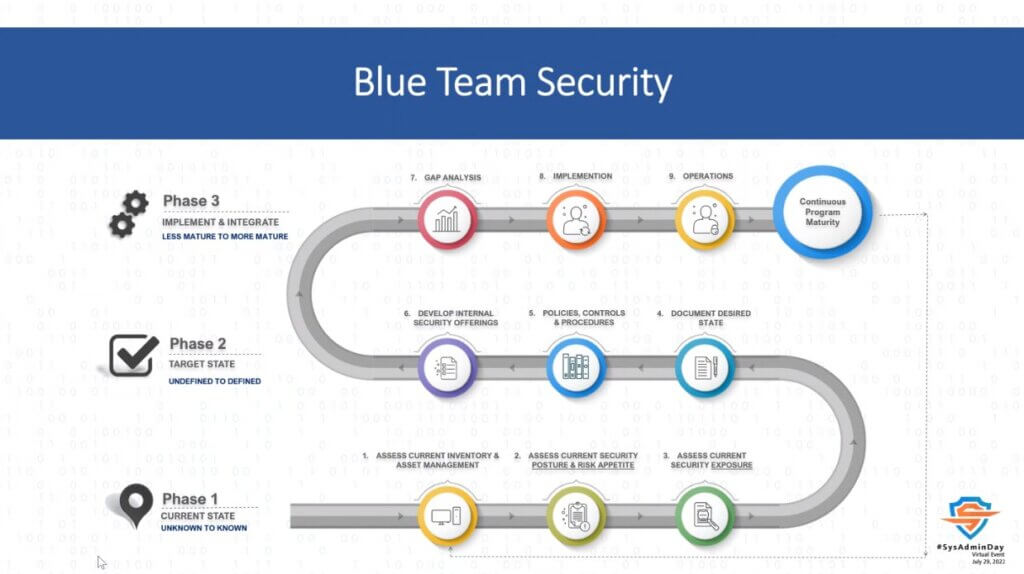
🛡️ Create Blue Security
- 1-1 Asset Inventory และหา Critical Asset
- 1-2 Security Posture
- 1-3 Security Explorer
- 2-1 Document it
- 2-2 Policy / Compliance - ดูว่าธุรกิจเราต้องมี Scope ตามไหน
- 2-3 Internal Security Offering - ต้องทำอะไรตาม 2-2
- 3-1 Gap Analysis - ดูว่าจาก 2-2/2-3 เรายังขาดอะไรบ้าง ต้องทำอะไรเพิ่ม ของบมาเพิ่มไหม อะไรที่ทำเองได้ หรือต้องจ้างคนอื่นมาเร็วกว่า
- 3-2 Implementation
- 3-3 Operation - ทำงานประจำต่อ Plan Do Check Ack จากนั้นต้องมาตรวจสอบ เช่น Awareness Training / Patch Checking เป็นต้น เพื่อลดงานเวลามีปัญหา
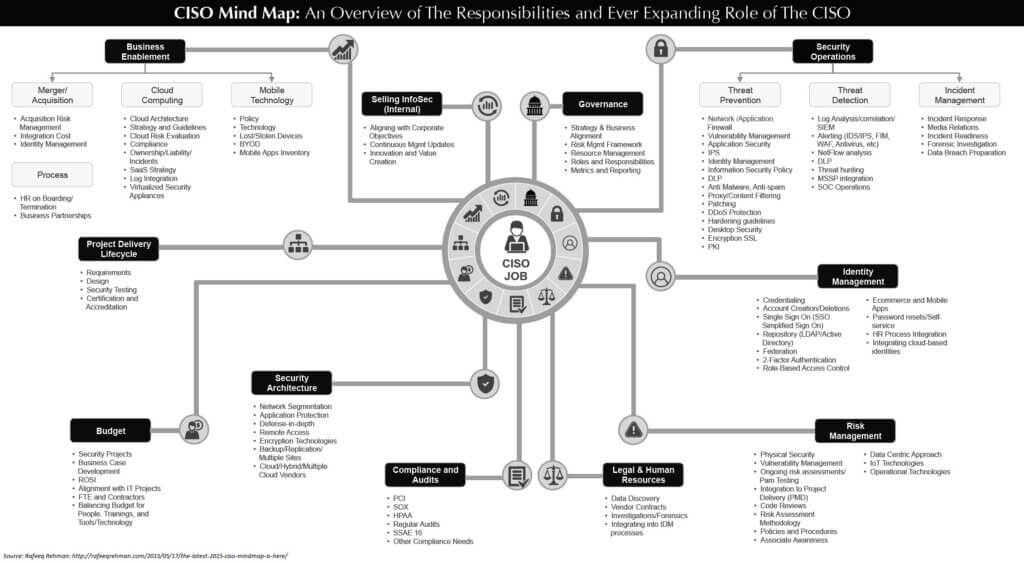
🛡️ CISO Map 2015 เอาไว้ ทำ Check List ขององค์กรได้ (2022 ก็มีนะ แต่ภาพมันใหญ่)
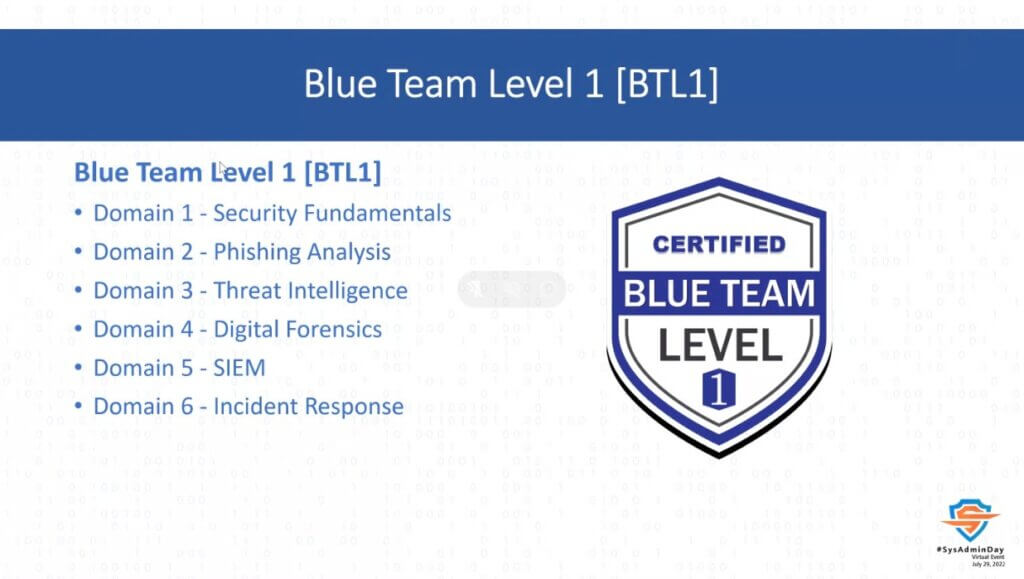
- BTL1 Exam
🛡️ Cyber Sec Certification
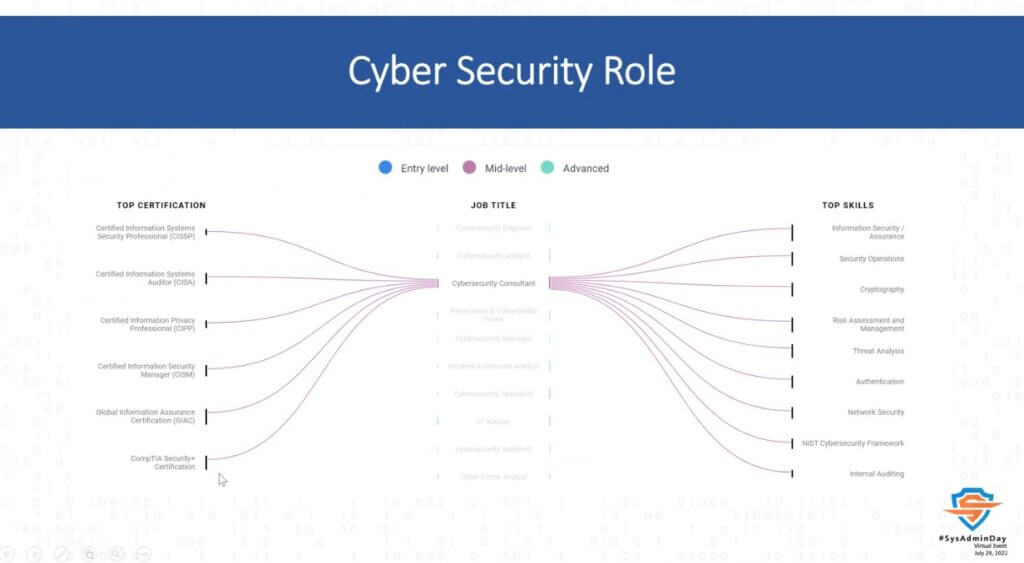
🛡️ BTL1 Exam ดีอย่างไร -
- เรียนเน้น Text base เป็นหลัก สายอ่านเน้นๆ นอกจาก Exam แล้วยังมี Lab และให้ลองเขียน Report
- เวลาสอบ 24 ชั่วโมง 12 ชั่วโมงเก็บหลักฐาน / 12 ชั่วโมงเขียน Report โหดอย่างกะเล่นเกมแบบ Speed Run เลย
- หัวข้อตาม Domain ดังนี้
Resource:
- Why BTL1 : Blue Team Level 1 Certification » Security Blue Team
- SECPlayground - SECPlayground Lab ของไทย
- Live
When you create the ClusterIP service in Kubernetes, what happens to the iptables rules?
Speaker Damrongsak Reetanon

- เวลาสร้าง Service ขี้นมา ใครเป็นคนบริหารจัดการ
- kube-proxy ทำงานเมื่อมีการเปลี่ยนแปลงกับ Service / End-Point มันจะเข้าไป Update iptables / IPVS
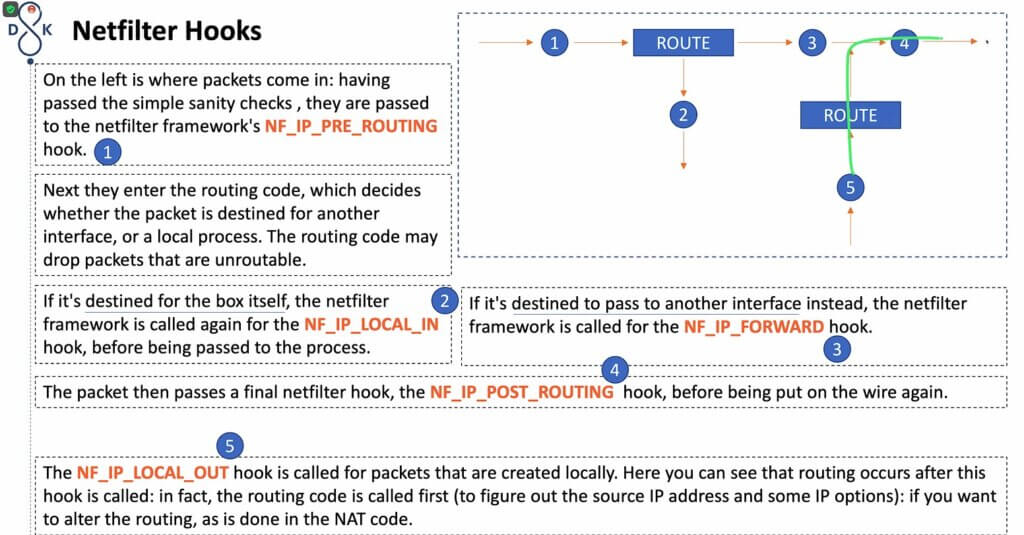
- NetFilter Concept
- NetFilter - เป็นที่ให้ตัว hook(call back) ของ Module ต่างๆ เข้า register เวลาที่ Module นั้นๆ มีอะไรเกิดขึ้นตาม package และเข้าเงื่อนไข call back ทำงาน
- iptables Concept
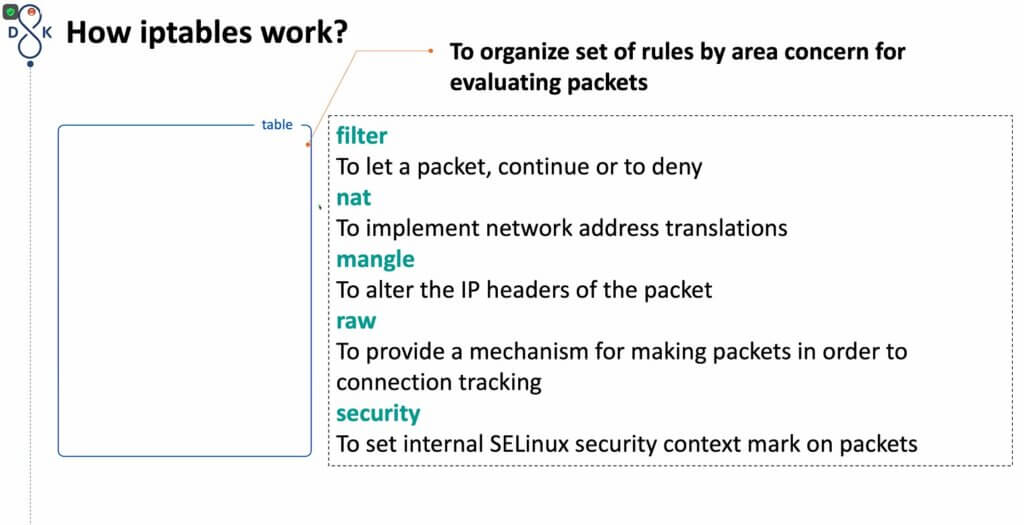
- iptables - ส่วนที่รับงานจาก hook ไปทำต่อ โดยตรวจสอบกับ config ที่เราได้ใส่ไป ถ้าจำไม่ผิดที่ผมเคยลองใน redhat 8 เหมือนจะใช้ firewalld (มันจะแอบไปเรียก iptables ต่อ)
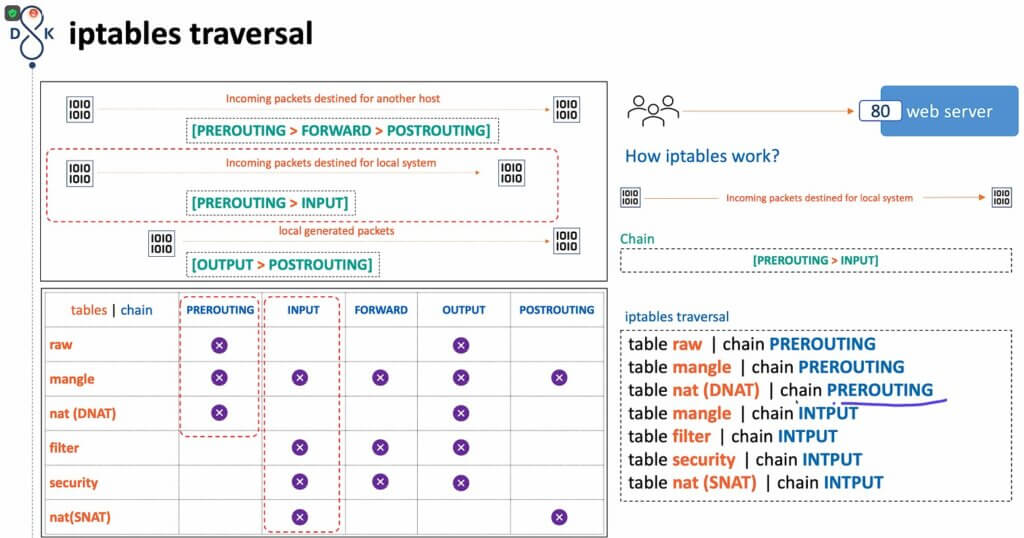
- filter - ใช้ประจำ
- nat - ทำ gateway firewall
- mangle
- raw - ใส่ packet เพื่อทำ Tracking
- security
- iptables chain - หมวดหมู่ของ rule ที่ต้องล้อกับ hook function + user define
- iptables rule
- matching เช่น Port หรือ IP *** เป็นต้น
- target - terminating target - ถ้าเจอ Rule แรกที่ผ่านแล้วไปเลย / non-terminating target ตรวจสอบ rule ไปเรื่อยๆ จะข้าม chain ก็ได้ จนถึง terminating target
- How iptables work - iptables chain match netfilter hooks
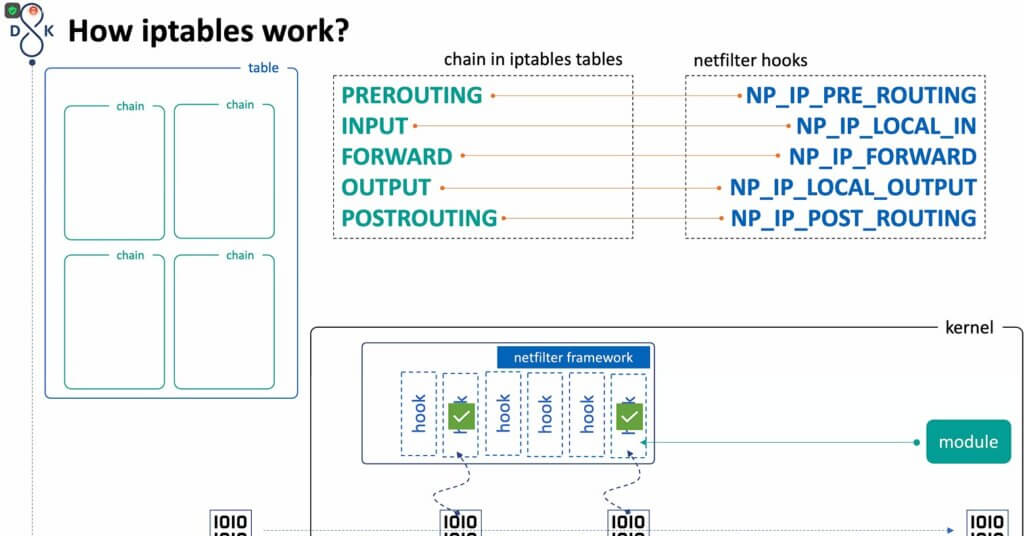
- สรุป chain hook สัมพันธ์อย่างไร
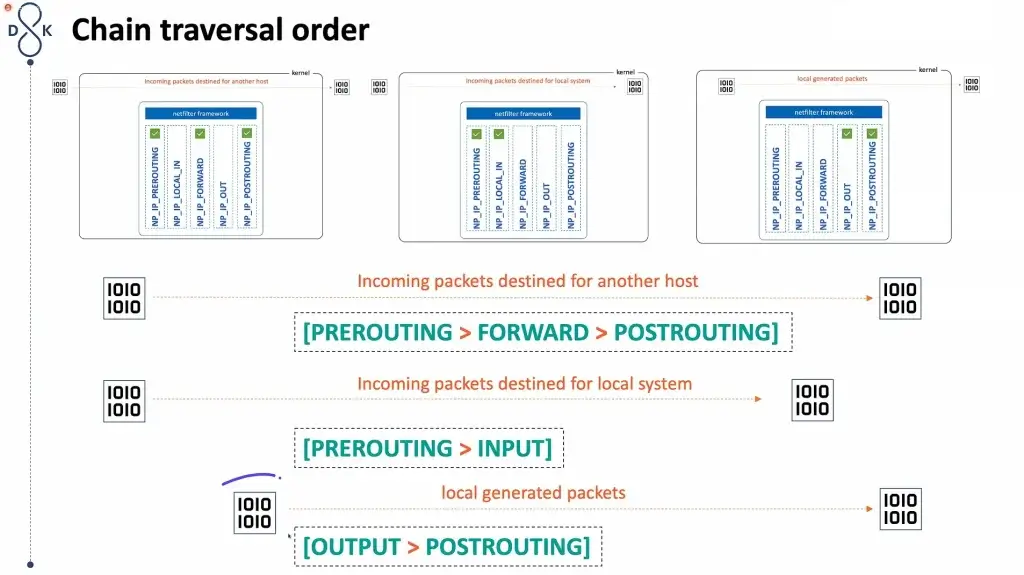
- ถ้า Request เข้า Web Server ที่ Port 80 มา Chain ไหนที่ทำงาน
- ฟังจบใช้ firewalld แหละ 55555 เคยใช้ iptables สองสามครั้งแล้วแขยง เหมือนกลับไปเรียนวิชา Network ยังไงก็ไม่รู้ ดีใจที่เป็น Dev อยู่
- Back to K8S
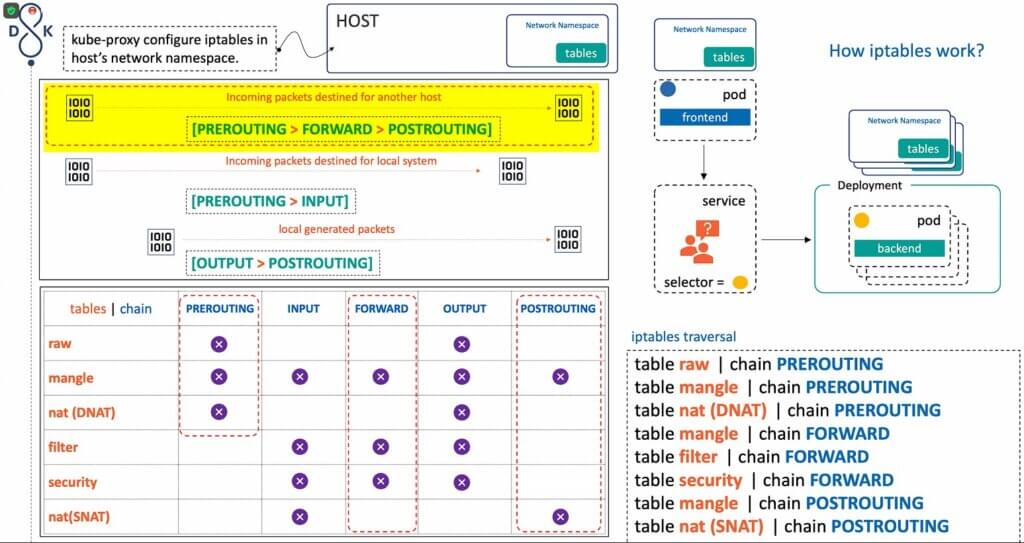
- ใน K8S จะเป็นแบบ Incoming Package > Destined for another host (Pod /Service) จากนั้นต้องไล่ Track ไปเรื่อยตาม table chain
Resource: ดำทำไร | Facebook / Netfilter framework providing hooks system for Nftables (teldat.com) / Live
GitLab on Docker
Speaker Natthakan Puangroi
อันนี้ ไม่ได้จดสักเท่าไหร่ จะเป็นการถามมากกว่า เพราะส่วนตัวเคย Implement Gitlab บน Docker ด้วยครับ เพราะว่าลองต่างกัน
- Q: ทำไมต้องใช้ docker compose (gitlab+redis+postgres) ผมเคยลงใช้ image ตัวเดียว
A: แยก redis+postgres ออกมาจัดการ และ Audit - Q: ตอน setup มีปัญหากับ ssh Port 22 ไหม
A: มีเพราะ OS ใช้อยู่ ทางที่ดีแก้ Port ไปเลย - Q: เห็นเวอร์ชันใหม่ๆ ตัว Static Code Analysis ของ gitlab อันนี้พอจะ Share ประสบการณ์ได้ไหมครับ
A: ไม่เคยลอง
Resource: Live / Docker Compose
Zero Trust Security
Speaker Wilasinee Rueangaram
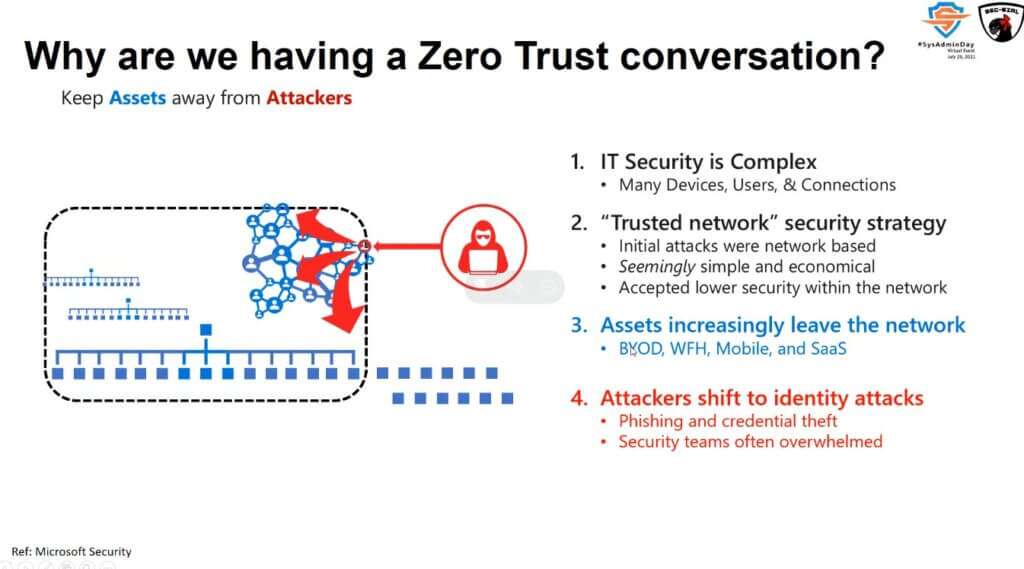
- ป้องกันอย่างไร ก็เชื่อใจไม่ได้ เพราะ
- IT Security is complex
- Trusted Network Security Strategy - vpn ถ้า hacker เข้าได้หละ
- Asset leave network - อุปกรณ์ใหม่ๆมามากขึ้น WFH / BYOD
- Attacker shift to identity attack
- Zero trust is mindset
- Zero trust framework

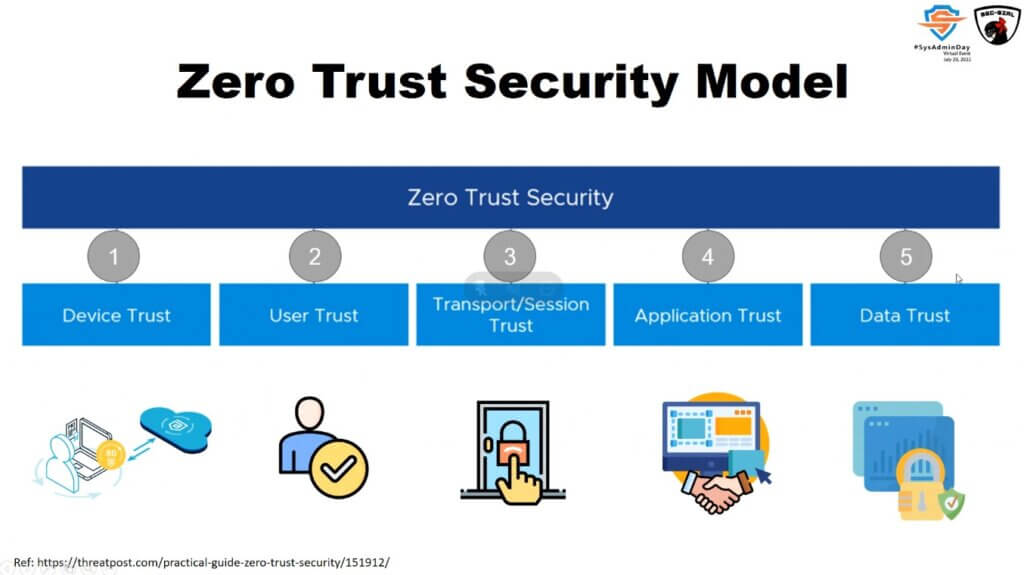
- Device Trust - จัดการอุปกรณ์ / patch / ติดตาม กรณีหายไปป้องกัน Data Breech ได้
- User Trust - Multifactor Authentication / Passwordless / Conditional Access Policy / Dynamic Risk Scoring (ดูว่า User มีความเสี่ยงจากไหน เช่น Location เปลี่ยนไป)
- Transport (Network) Trust
- Least Privilege กันกรณีถ้าหลุดจริงๆ จะมี Scope ที่เล็กลง
- App Tunnel
- Application Trust - SSO มาช่วย
- Data Trust - C.I.A.
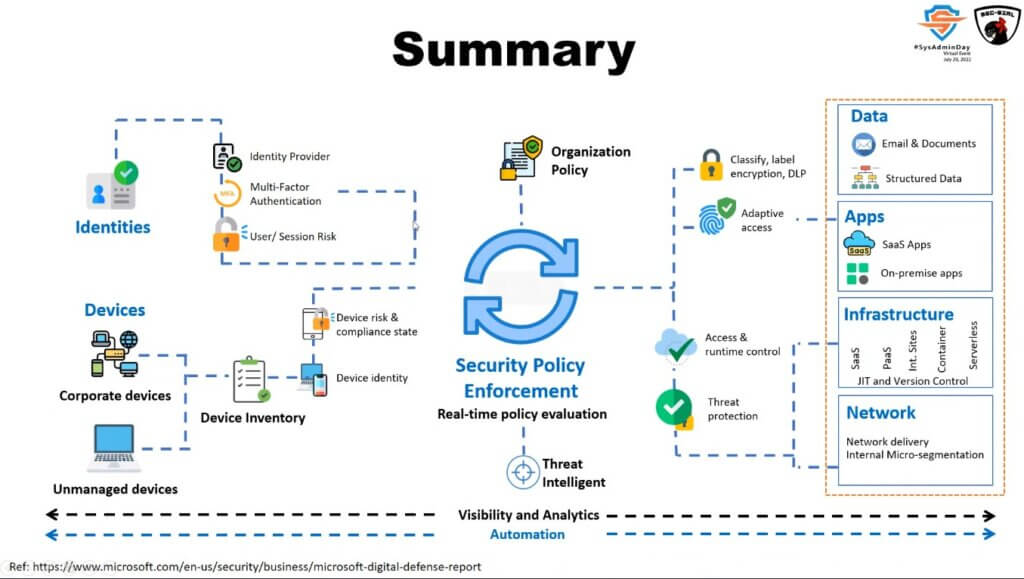
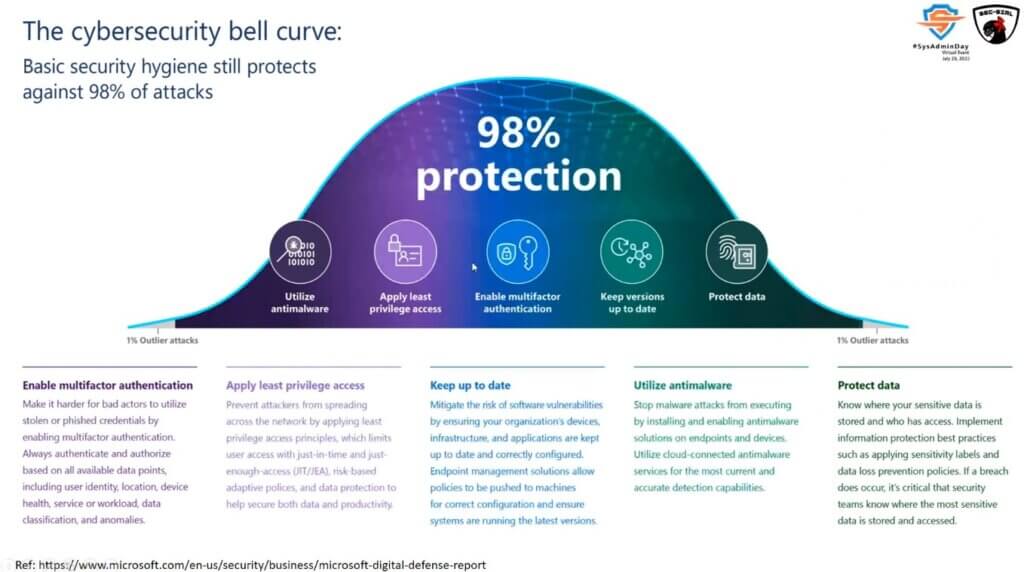
โดยที่จะต้องสามารถตรวจสอบได้ (Visibility) และก็ Automation - Warp-Up ตามรูป
- ปิดท้าย Security Bell-Curve
NOTE session นี้นึกถึง Azure SC-900 เลย
Resource: Live
System Monitoring
Speaker Narate Ketram
💖 Monitor ทำให้รู้ Trend หรือแนวโน้ม โดยมี Tools หลายตัว
- Datadog
- ZABBIX - Agent base
- Nagios
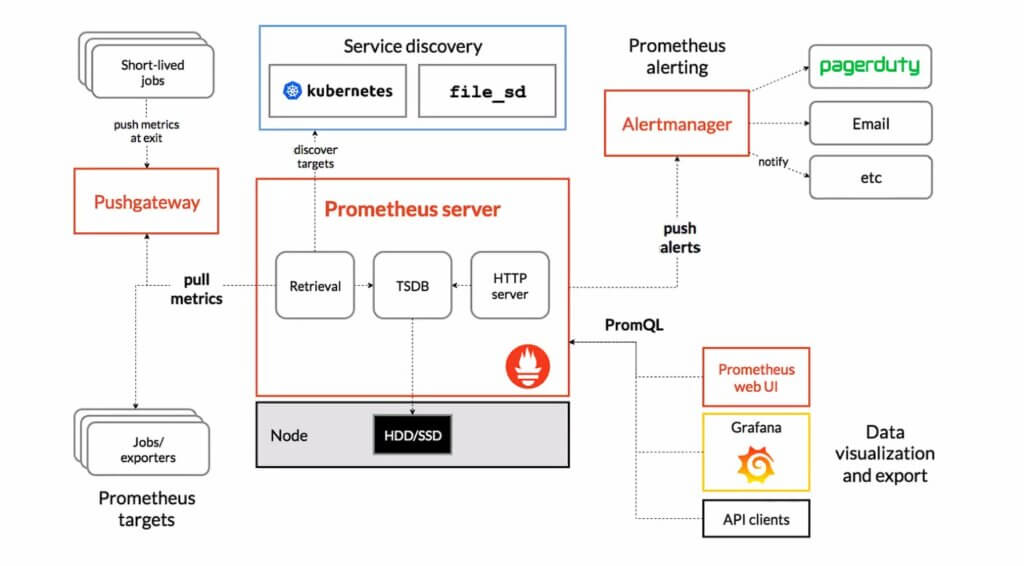
- Prometheus - metric collector จะนับเป็น time series db เลยก็ได้ ว่าตัว Workload แต่ละตัวมีสถานะอย่างไร
💖 Prometheus - Architecture เรียกภาพว่ายังดี Central Metric
- API รับ Metric ที่ถูก pull เข้ามา ตัว Prometheus Exporter - takes application-formatted metrics and converts them to Prometheus metrics
- ถ้ามีปัญหา มันจะมี Push ไป Alert Manager
- PromQL ภาษาที่ให้ Tools ต่างๆ มา Visualize อย่าง Grafana / Prometheus web UI
💖 นอกจาก Monitor System แล้ว ยังมี Monitor พวก Application
- API Usage เช่น ใช้ฟรียิงได้วันละ 5 ครั้ง จ่ายเงินจะได้ได้มากกว่า
- Service Uptime Monitoring - อย่างตัว Tools uptimerobot / uptime kuma (Open Source)
💖 Q&A
- Q: ปกติถ้า monitor node กับ service เราควรจะโฟกัสเรื่องอะไรบ้างครับ
A: เน้นตัวที่ Critical - Q: อยากเริ่ม ศึกษา Kong API Gateway ต้องเรียนรู้อะไรบ้างครับ
A: HTTP Status Code / Security
Resource: Live
Reference
- Virtual Event : System Administrator Appreciation Day 2022 | SysAdminDay.github.io (ถ้าย้อนไปปีก่อนๆจะมี VDO ที่อัดไว้ด้วยนะครับ)
Discover more from naiwaen@DebuggingSoft
Subscribe to get the latest posts sent to your email.